Instagram statistics and analysis for @dinewithtasha

@dinewithtasha
Easy recipes
Meal prep ideas
Food and wine pairings
Food styling & photography
📍PE 🇿🇦
Followers
26.1K
Engagement
0.42%
Selected content
Publication insights
Engagement
Average 0.4%
Higher than 37% of influencers.
Content reactions
Average 101.50 8.50
Higher than 47% of influencers.
Estimated reach
Average 164
Higher than 45% of influencers.
Recency
Very recently 3 days
More recently than 77% of influencers.
Post per week
Average 0.93
Higher than 53% of influencers.
Audience insights
Followers evolution
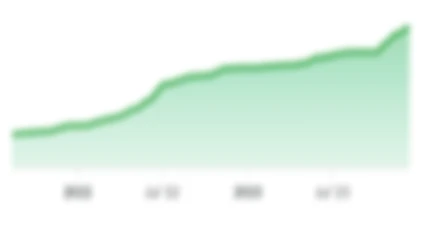
Unlock report
Authenticity
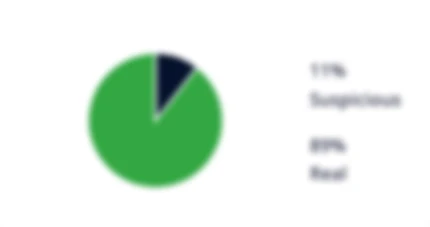
Unlock report
Location
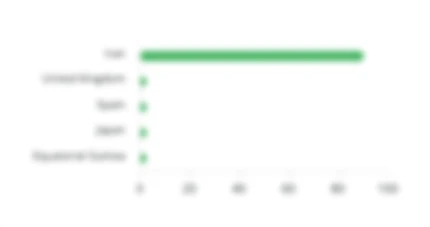
Unlock report
Language
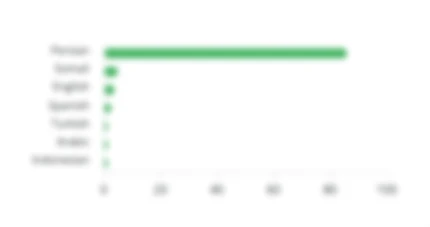
Unlock report
Age
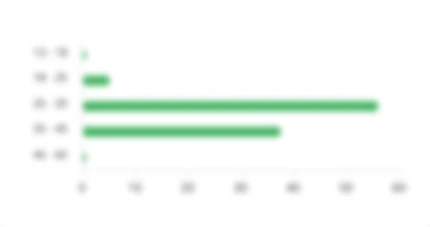
Unlock report
Gender
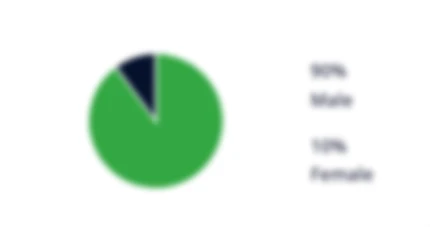
Unlock report
Interests
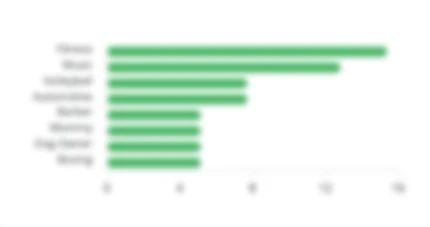
Unlock report
Selected mentions
@mrslambley
@dewetshofwines
@kitchenique_